Lead investigation
When the monitors stopped giving PM2.5 and PM10 values
At 1 AM on 9 November 2026, 36 of the 59 stations in CPCB's hourly data for Delhi had no PM2.5 reading, and 23 had one. Counted on each night's own list of stations, that was the fewest with a reading in any hour from 8 PM to 7 AM across the 36 nights from 4 October 2026 to Diwali.
Read the hour-by-hour record, the Supreme Court's orders and the source files (English)
Special investigation
13 new monitors lowered Delhi's AQI on all 26 days, by 11.6 points on average
Thirteen monitors added in October lowered Delhi's 4 PM AQI by 11.6 points on average from 13 October to 7 November 2026.
Read the investigation (English)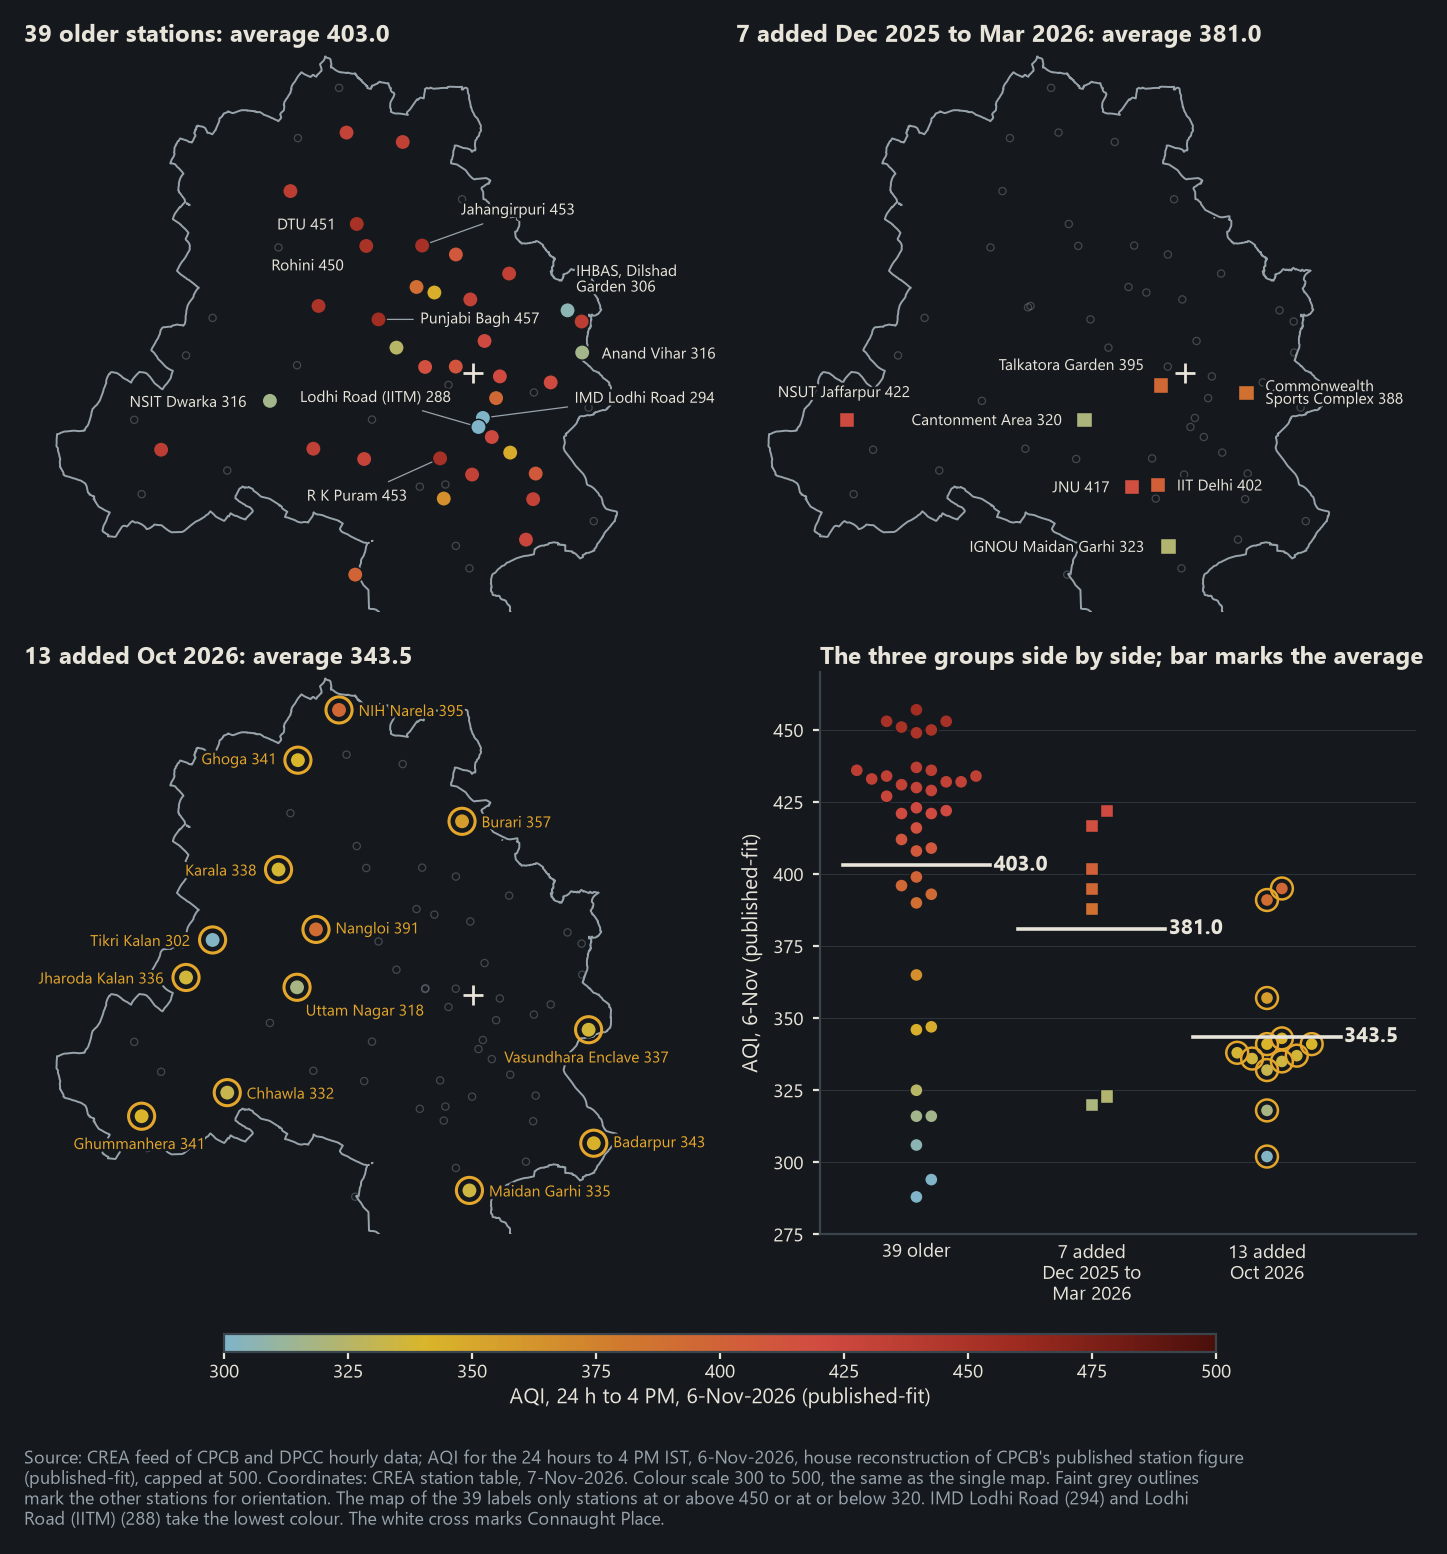
CAQM claimed progress. CPCB's own data show Delhi's air got worse.
On CPCB's daily bulletin, Delhi's average AQI for January to September rose to 167.6 in 2026 from 164.3 in 2025.
CAQM's claims, checked
The release of 30 September, claim by claim: CPCB's January to September average AQI rose to 167.6.
Letter to CAQM's Members
Shri Ajay Maken asks CAQM's two non-official Members to have the January to August statistics published.
The full report, 11 pages
On 38 stations reporting in both years, PM2.5 this year rose to 70.7 from 69.2 µg/m³.
The one-page summary
On 39 matched stations, PM2.5 alone held AQI at 500, the scale's limit, for 719 station-hours against 221 in 2025.
Watch the films: Delhi's air got worse in 2026
Delhi's air got worse: in Hindi
PM2.5 alone held AQI at 500 for 719 station-hours on 39 stations by 28 September; 2025 had 221.
Delhi's air got worse: in English
CAQM's release left out the nine-month average AQI, which on CPCB's bulletin rose to 167.6 from 164.3.
The latest report · 14 November 2026
500 AQI at IIT Delhi, 24 hours to 4 PM, 14 November 2026, the worst monitor in Delhi today, Severe on CPCB's documented formula, and PM10 set that figure. 7.2 lakh people live within 4 km of it.
The latest report
The full report
The complete written report for this day, with every figure and the source it comes from.
Read
The archive
One report for every day the monitoring network reported enough stations to publish honestly.
See the daily archive
The films
A short film every day, narrated in Hindi, built from the same analysis as that day's written report.
Watch the films
Investigations
Standalone investigations that go beyond the daily record.
See the investigations
The method
How each AQI figure is calculated with CPCB's own published formula, and where every number comes from.
How it works
Who publishes this
Published by Shri Ajay Maken, Member of Parliament, Rajya Sabha, on official CPCB monitoring data. The analysis, and any error in it, is ours.
About and contactThe destruction of Delhi's air
1980 to July 2026: 46 full calendar years, followed by a partial year
Delhi's government monitors recorded an annual PM2.5 mean of 97.0 micrograms per cubic metre in 2025, on the study's fixed panel. That was 19.4 times the WHO annual guideline of 5. The winter ending in 2026 averaged 200.5, a separate seasonal measure. The report keeps measured recent pollution apart from the less certain early history, and explains the observing-system change around 2000.
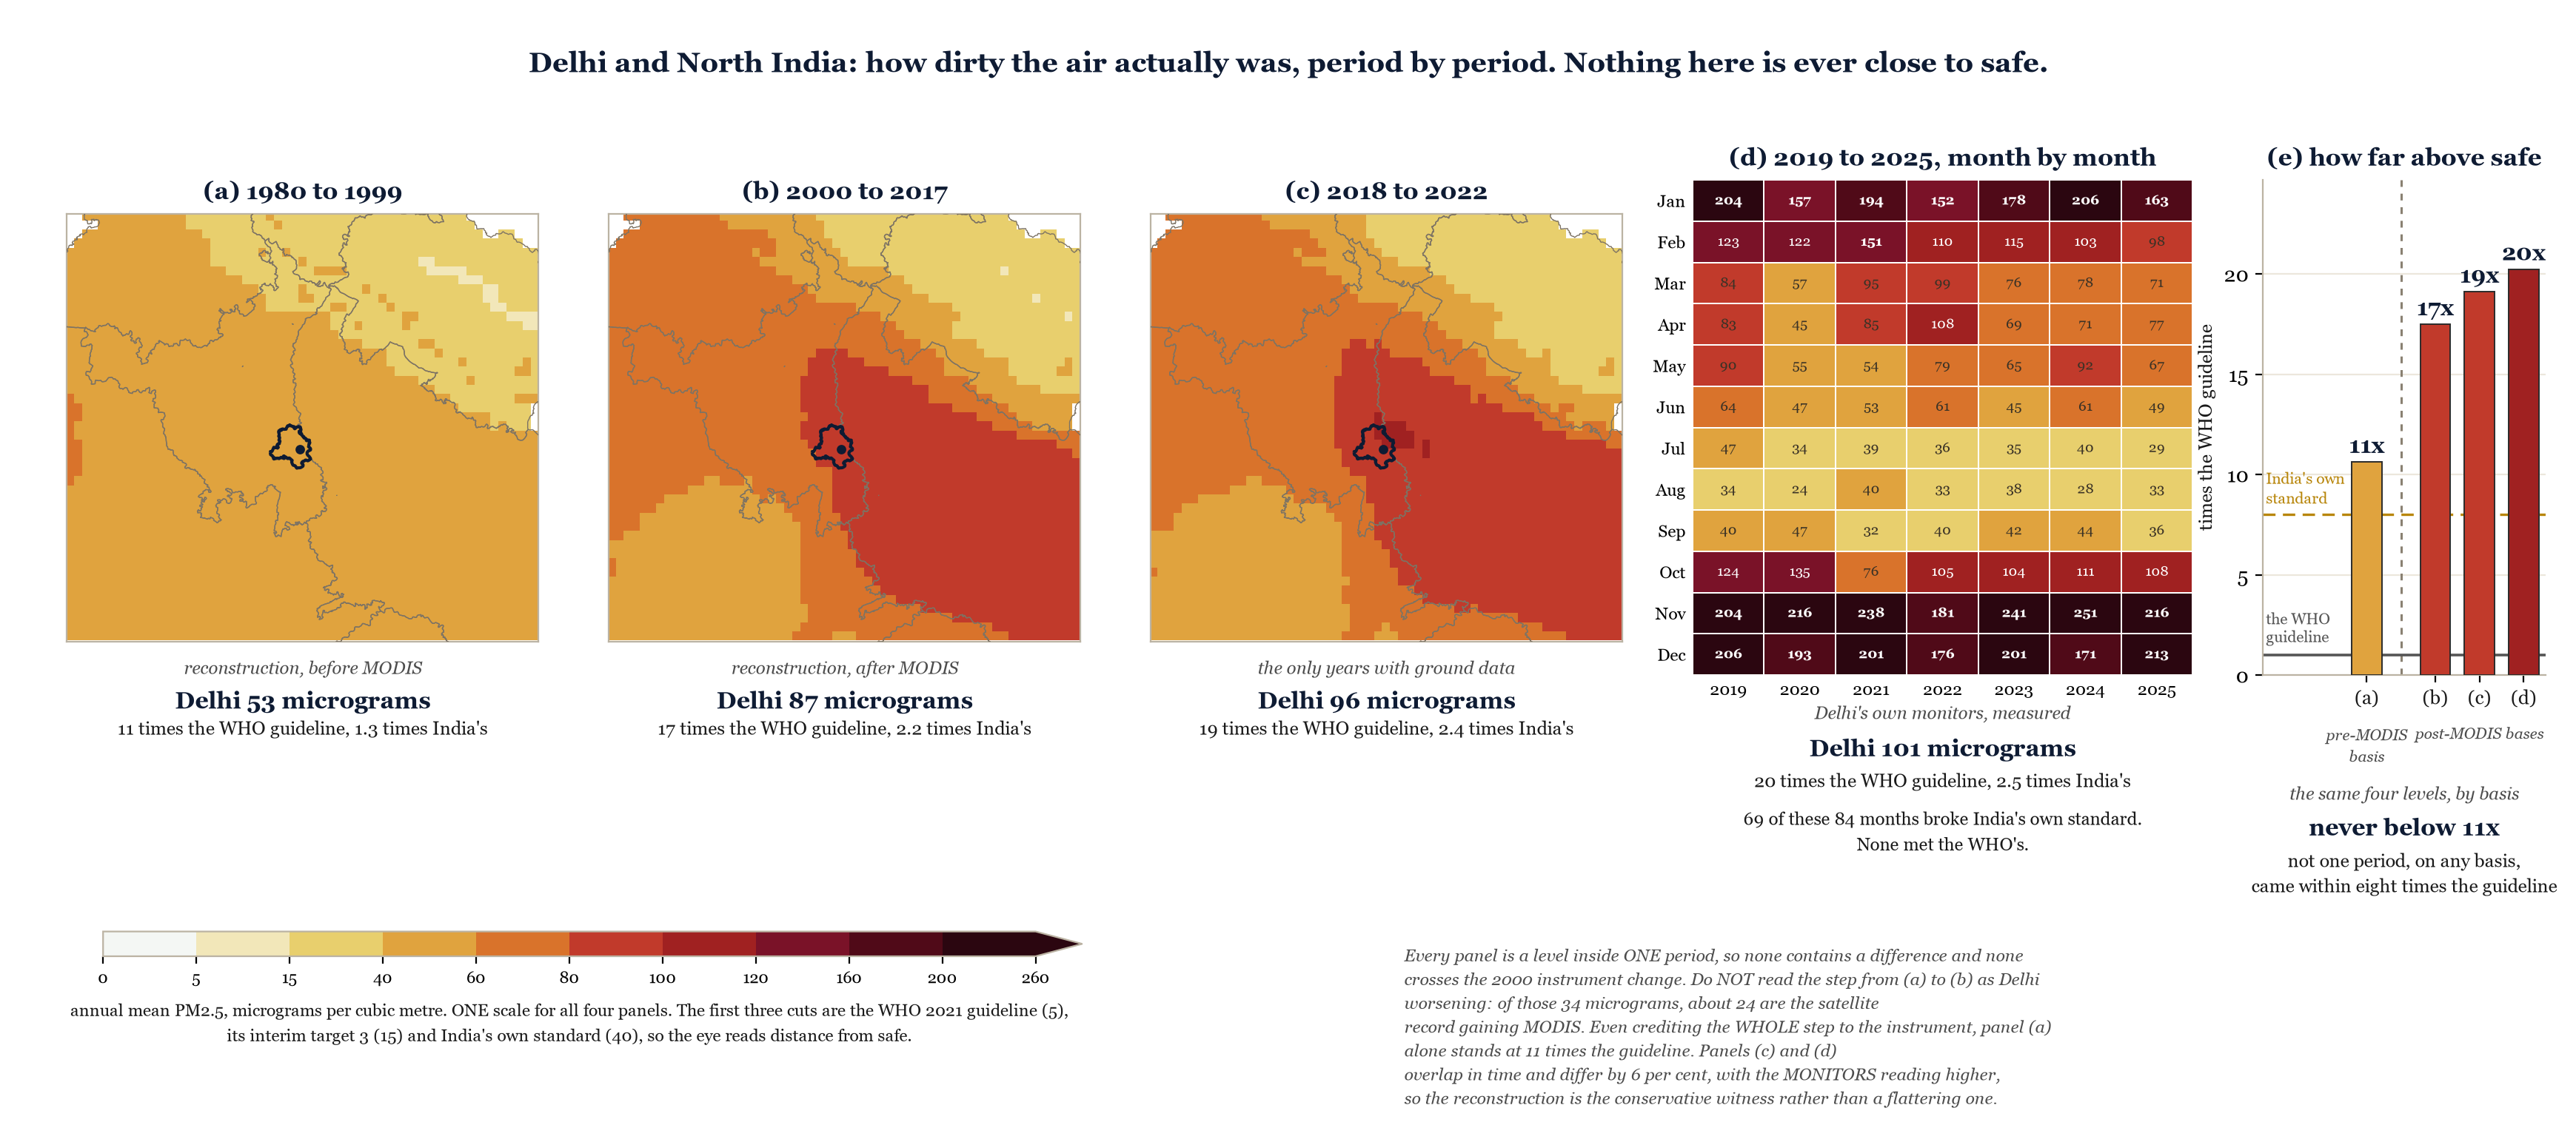
Fixed-panel Delhi annual PM2.5 in 2024 and 2025, in micrograms per cubic metre. The lines mark India's annual reference of 40 and the WHO annual guideline of 5. Source: CPCB and DPCC monitors via CREA. The historical study ends on 31 July 2026.
With thanks
With special thanks to the Centre for Research on Energy and Clean Air (CREA). Its hourly compilation of the official station data is what this analysis is built on, and its own work has done a great deal to create public awareness of the air. CREA has no involvement in this site and bears no responsibility for its analysis or conclusions.