PUBLIC RECORD
Published by Ajay Maken | 9 November 2026 | hawakahisab.in
Annexure A. Sources and how the counts were made
Annexure B. The documents linked from this page
This page puts on record, with a date, the figures which a forthcoming film presented by Ajay Maken will use when it describes Delhi’s air monitoring on Diwali night. Each figure below carries its source and the hours that it covers, and it names the number of stations against which it is counted. The figures come from CPCB’s hourly station data, as compiled by CREA, from CPCB’s own public dashboard as this office captured it, and from the Supreme Court’s orders, each of which can be opened from Annexure B.
Each count on this page is read against the list of stations that its own year had. In 2025 that list held 40 stations and in 2026 it held 59, so the counts of the two years are not set against each other.
“Across the eight Diwali nights from 2018 to 2025, CPCB’s hourly data for Delhi never held PM2.5 readings from fewer stations, in any hour between 8 PM and 7 AM, than at 2 AM on Diwali night 2025.”
“At that hour, on 21 October 2025, only 12 of the 40 stations had a PM2.5 reading. A week earlier, at the same hour, all 40 did.”
A station here is a distinct CPCB site in CREA’s compilation of CPCB’s hourly data, and it is counted in an hour when that hour holds a numeric PM2.5 value for it. The eight nights are the Diwali dates which the table below lists, and the hours that are counted run from 8 PM to 7 AM. The record holds both by the number of stations and by their share of each night’s list, because that list ran from 36 to 40 stations across the eight years.
On each of the eight Diwali nights from 2018 to 2025, the fewest stations with a PM2.5 reading in any hour from 8 PM to 7 AM was below the same night a week earlier. On six of the eight, it was the lowest of the 50 nights from five weeks before Diwali to two weeks after; in 2022 and 2024 it was not. 2025 was the lowest of the eight, at 12 of 40.
| Diwali night | Stations on the night’s list | Fewest with a PM2.5 reading, 8 PM to 7 AM | Share of the list | Fewest on the same night a week earlier | Fewest with a PM10 reading | Station-hours with no PM2.5 reading, 8 PM to 4 AM | Of which other pollutants were recorded |
|---|---|---|---|---|---|---|---|
| 7 Nov 2018 | 36 | 17 | 47.2% | 34 | 9 | 96 | 96 |
| 27 Oct 2019 | 37 | 25 | 67.6% | 34 | 16 | 40 | 40 |
| 14 Nov 2020 | 38 | 23 | 60.5% | 34 | 16 | 63 | 63 |
| 4 Nov 2021 | 39 | 15 | 38.5% | 32 | 13 | 110 | 109 |
| 24 Oct 2022 | 37 | 31 | 83.8% | 35 | 29 | 16 | 16 |
| 12 Nov 2023 | 38 | 19 | 50.0% | 34 | 13 | 72 | 63 |
| 31 Oct 2024 | 38 | 31 | 81.6% | 36 | 17 | 31 | 22 |
| 20 Oct 2025 | 40 | 12 | 30.0% | 40 | 6 | 115 | 115 |
Across all eight nights there were 543 station-hours when a station had no PM2.5 reading, and in 524 of them, which is 96.5 per cent, the same station recorded another pollutant in that hour.
Source: CPCB hourly station data for the eight Diwali nights from 7 November 2018 to 20 October 2025 and the nights a week earlier, as compiled by CREA (Annexure A)
All 40 stations had a PM2.5 reading at 9 PM on 20 October 2025, as the table below shows. On the night a week earlier, which ran from 13 to 14 October, all 40 had one in every hour from 4 PM to 8 AM.
| Hour | Stations with a PM2.5 reading, of 40 |
|---|---|
| 9 to 10 PM, 20 Oct | 40 |
| 10 to 11 PM | 35 |
| 11 PM to midnight | 28 |
| Midnight to 1 AM, 21 Oct | 19 |
| 1 to 2 AM | 15 |
| 2 to 3 AM | 12 |
| 3 to 4 AM | 16 |
| 4 to 5 AM | 25 |
| 5 to 6 AM | 22 |
| 6 to 7 AM | 32 |

Source: CPCB hourly station data for 13 to 14 and 20 to 21 October 2025, as compiled by CREA (Annexure A)
“At 1 AM, 6 of the 40 stations had a PM10 reading in the record. A week earlier, at the same hour, 38 did.”
Both counts are for the hour from 1 to 2 AM, which fell on 21 October 2025 on Diwali night and on 14 October 2025 a week earlier.
Source: CPCB hourly station data for 13 to 14 and 20 to 21 October 2025, as compiled by CREA (Annexure A)
Thirty stations had no PM2.5 reading for at least one hour between 8 PM and 4 AM. When the PM2.5 record broke at each station, the last hourly reading had a median of 849 micrograms per cubic metre, across those 30 stations. Eighteen of the 30 last readings were at or above 800 micrograms per cubic metre. Each of these is a single hour’s reading.
Source: CPCB hourly station data for 20 and 21 October 2025, as compiled by CREA (file and method in Annexure A)
At Anand Vihar the record holds no PM2.5 reading from 11 PM to 4 AM, while the same station’s carbon monoxide, nitrogen oxides, ozone and sulphur dioxide readings continue in every one of those hours. Before the gap began, the station’s last PM2.5 reading was 627 micrograms per cubic metre, which was for the hour from 10 to 11 PM on 20 October 2025. When the readings returned after the gap, the first was 656, for the hour from 4 to 5 AM on 21 October.
Source: CPCB hourly station data for 20 and 21 October 2025, as compiled by CREA (file and method in Annexure A)
A year later, the compilation of CPCB’s hourly data that this office uses, kept by CREA, still holds no PM2.5 reading for those hours (queried 18:15 IST, 8-Nov-2026). The query returned 40 stations with a PM2.5 reading at 9 PM and 12 at 2 AM, the same counts as before, at every hour of the night.
Source: CREA’s live service for CPCB’s hourly station data, queried at 18:15 IST on 8 November 2026 (Annexure A)
From midnight on 1 November until 4 PM on 8 November 2026, the number of stations that had a PM2.5 reading stayed between 55 and 59 of 59 in every hour. The lowest was 55, which held for the three hours from 8 to 11 PM on 5 November. On the night of 1 to 2 November, which was a week before Diwali night, the count from 6 PM to 7 AM ranged from 56 to 59, as it also did on the night of 7 to 8 November.
The night of 7 to 8 November was itself a permitted cracker night under direction A of the Supreme Court’s order of 29 October 2026. Last year the eve, the night of 19 to 20 October 2025, was also a permitted night under direction E of the order of 15 October 2025, and its count held at 40 of 40 in every hour from 6 PM to 7 AM. The eve holding full did not foretell the night last year.
On the night of 7 to 8 November 2026, the count of stations that had a PM10 reading fell to 51 of the 59, and the hour when that happened was the hour from 4 to 5 AM on 8 November. Eight stations had no PM10 reading in that hour, although every one of the eight still had a PM2.5 reading:
At Burari Crossing the record holds no PM10 reading for the four hours from 1 to 5 AM on 8 November 2026, while in those same hours its PM2.5 readings were 807.7, 932.2, 822.9 and 841.0 micrograms per cubic metre. Its PM10 reading returned in the hour from 5 to 6 AM, when it read 911.0. The station’s carbon monoxide, nitrogen oxides and ozone readings were recorded in every hour.
Source: CPCB hourly station data, 1 to 8 November 2026, as compiled by CREA, file received at 9:45 AM on 9 November 2026 (Annexure A)
This office’s daily record for the 24 hours to 9 AM on 8 November 2026 gives Delhi 412.1 on CPCB’s documented formula, which is the mean of 59 stations and falls in the Severe band. Burari Crossing read 500, which was set by PM2.5, and its 24-hour PM2.5 was 393 micrograms per cubic metre.
Source: this office’s daily record for the 24 hours to 9 AM on 8 November 2026, from CPCB hourly station data as compiled by CREA
“In the three days before this Diwali, 5 to 7 November, the 23 monitors that have reported in every year since 2018 recorded an average PM2.5 of 258 micrograms per cubic metre. For the three days before any Diwali from 2018 to 2026, that is the highest; the next was 219, in 2018.”
The figure for each year is the mean of the daily means at these monitors, taken over the three calendar days that came before Diwali. A day is counted at a monitor when it has at least 16 of its 24 hourly readings. In 2022 and 2023, 22 of the 23 monitors met that test over the three days, and the table shows each year’s count.
| Diwali | The three days before | PM2.5, micrograms per cubic metre | Monitors counted |
|---|---|---|---|
| 7 Nov 2018 | 4 to 6 Nov | 219.4 | 23 |
| 27 Oct 2019 | 24 to 26 Oct | 151.4 | 23 |
| 14 Nov 2020 | 11 to 13 Nov | 187.9 | 23 |
| 4 Nov 2021 | 1 to 3 Nov | 147.7 | 23 |
| 24 Oct 2022 | 21 to 23 Oct | 121.1 | 22 |
| 12 Nov 2023 | 9 to 11 Nov | 179.1 | 22 |
| 31 Oct 2024 | 28 to 30 Oct | 141.9 | 23 |
| 20 Oct 2025 | 17 to 19 Oct | 129.9 | 23 |
| 8 Nov 2026 | 5 to 7 Nov | 258.1 | 23 |
The 23 monitors are these:
Source: CPCB hourly station data for the three days before each Diwali from 2018 to 2026, as compiled by CREA (method in Annexure A)
At 1 AM on 9 November 2026, 23 of the 59 stations in CPCB’s hourly data for Delhi had a PM2.5 reading, and 36 had none. The hour is 1 to 2 AM.
A week earlier, at 1 AM on 2 November 2026, 58 of the 59 had a PM2.5 reading.
Of the 36 nights from 4 October 2026 to Diwali, Diwali night had the fewest stations with a PM2.5 reading in any hour from 8 PM to 7 AM, counted on each night’s own 14-day list of stations. On Diwali night the fewest was 23 of 59, while the next fewest by share was on 29 October, when 45 of 59 had a reading.
| Hour | Stations with a PM2.5 reading, of 59 | Stations without one |
|---|---|---|
| 8 to 9 PM, 8 Nov | 59 | 0 |
| 9 to 10 PM | 57 | 2 |
| 10 to 11 PM | 52 | 7 |
| 11 PM to midnight | 36 | 23 |
| Midnight to 1 AM, 9 Nov | 30 | 29 |
| 1 to 2 AM | 23 | 36 |
| 2 to 3 AM | 24 | 35 |
| 3 to 4 AM | 29 | 30 |
| 4 to 5 AM | 38 | 21 |
| 5 to 6 AM | 40 | 19 |
| 6 to 7 AM | 43 | 16 |
| 7 to 8 AM | 46 | 13 |
The data file of 9:45 AM on 9 November and CREA’s later copy of the same data agree exactly in every hour from 6 PM to 8 AM, which means that the count is settled up to the hour from 7 to 8 AM. The hour from 8 to 9 AM was still being filled in when the file was made, so no figure on this page uses it.

Source: CPCB hourly station data for 2 November and 8 to 9 November 2026, as compiled by CREA, file received at 9:45 AM on 9 November 2026 (Annexure A)
At 1 AM on 9 November 2026, which is the hour from 1 to 2 AM, 26 of the 39 older stations in CPCB’s hourly data for Delhi had no PM2.5 reading. In the same hour, 5 of the 13 stations that first gave PM2.5 readings in October 2026 had none, and 8 had one.
The 39 older stations are the Delhi stations that were already on the list at Diwali 2025. The 13 are stations run by DPCC, and their first PM2.5 readings in CPCB’s hourly data came between 6 and 12 October 2026. Seven more stations, added between December 2025 and March 2026, make up the 59 stations in CPCB’s hourly data for Delhi this year. The 7 are counted apart from both groups, as they were in this office’s investigation of 7 November 2026.
From 13 October to 7 November 2026, the 13 read about 35 per cent less PM2.5 than the older Delhi stations nearest them. That investigation measured each station’s daily average against the average of its seven nearest older stations, and 35 per cent is the median of 325 such station-days. Taken instead as the median of each station’s own median, the gap is 33.8 per cent. When the NCR monitors across Delhi’s boundary are counted as neighbours, that 33.8 per cent narrows to 29.5 per cent.
Source: Investigation of the new stations, 7 November 2026, findings N14 and N23; CPCB hourly station data as compiled by CREA, 13 October to 7 November 2026.
On its front page of 7 November 2026, the Hindustan Times reported that “Most of the new monitors, set up by the Delhi Pollution Control Committee (DPCC), the city government’s pollution regulator, are on the city’s periphery”. Measured from the published station positions, 10 of the 13 lie within 5 km of Delhi’s boundary, against 12 of the 39 older stations.
Source: Hindustan Times, front page, 7 November 2026, “New stations on periphery cloud AQI data in Capital”, by Binayak Dasgupta, Saloni Bhatia and Jasjeev Gandhiok; station positions as listed on 6 November 2026, measured against the NCT boundary by this office.
On Diwali evening, from 6 PM to 10 PM on 8 November 2026, at least 57 of the 59 stations had a PM2.5 reading in every hour. Measured in the same way hour by hour, against the seven nearest older stations reporting in that hour, the 13 read 35.5 per cent less PM2.5 than those neighbours. That figure is the median of 52 station-hours, and the 13 read below their neighbours in each of the four hours. Measured in the same way, the 39 older stations read 7.9 per cent below their own nearest older stations that evening. Both comparisons use Delhi’s own stations only.
From 10 PM until 8 AM, in every hour, the share of stations without a PM2.5 reading was larger among the 39 older stations than among the 13. Of the 23 stations with a reading at 1 AM, 8 were from the 13, 13 were from the 39 older stations and 2 were from the 7. In the hours from 6 to 7 PM and from 8 to 9 PM, every one of the 59 had a reading, and the 13 were 13 of the 59.
At no hour of the night were the 13 the only stations with a PM2.5 reading, and at no hour were they half of them. The most was 8 of 23, at 1 AM. The only two hours in which all 13 and all 39 had a reading were 6 to 7 PM and 8 to 9 PM. In those two hours the median PM2.5 reading of the 13 was 126 micrograms per cubic metre, against 170 micrograms per cubic metre for the 39, which is 25.8 per cent lower. The 7 read a median of 143 micrograms per cubic metre in the same two hours.
The larger share of the 13 after 10 PM is a fact about which stations had a reading. It does not by itself show that any average for the night came out lower.
Each cell of the table below counts the stations with a PM2.5 reading in that hour.
| Hour | The 39 older stations | The 7 added from December 2025 to March 2026 | The 13 that began in October 2026 | All 59 | Of the stations with a reading, from the 13 |
|---|---|---|---|---|---|
| 6 to 7 PM, 8 Nov | 39 | 7 | 13 | 59 | 13 of 59 |
| 7 to 8 PM | 38 | 7 | 13 | 58 | 13 of 58 |
| 8 to 9 PM | 39 | 7 | 13 | 59 | 13 of 59 |
| 9 to 10 PM | 37 | 7 | 13 | 57 | 13 of 57 |
| 10 to 11 PM | 32 | 7 | 13 | 52 | 13 of 52 |
| 11 PM to midnight | 23 | 5 | 8 | 36 | 8 of 36 |
| Midnight to 1 AM, 9 Nov | 18 | 3 | 9 | 30 | 9 of 30 |
| 1 to 2 AM | 13 | 2 | 8 | 23 | 8 of 23 |
| 2 to 3 AM | 14 | 2 | 8 | 24 | 8 of 24 |
| 3 to 4 AM | 20 | 2 | 7 | 29 | 7 of 29 |
| 4 to 5 AM | 25 | 2 | 11 | 38 | 11 of 38 |
| 5 to 6 AM | 27 | 2 | 11 | 40 | 11 of 40 |
| 6 to 7 AM | 30 | 2 | 11 | 43 | 11 of 43 |
| 7 to 8 AM | 32 | 2 | 12 | 46 | 12 of 46 |
Source: CPCB hourly station data for 8 to 9 November 2026, as compiled by CREA, file saved at 5:05 PM on 9 November 2026; stations grouped by site id as in the investigation of 7 November 2026; PM2.5 in micrograms per cubic metre; this office’s count (Annexure A).
These data cannot show whether the readings of the 13 or those of the 39 older stations are right. Only a reference instrument run beside a station can settle that.
This office’s investigation of the new stations, dated 7 November 2026, gives the October figures with their method and cautions: https://hawakahisab.in/reports/special/new-stations-and-aqi.
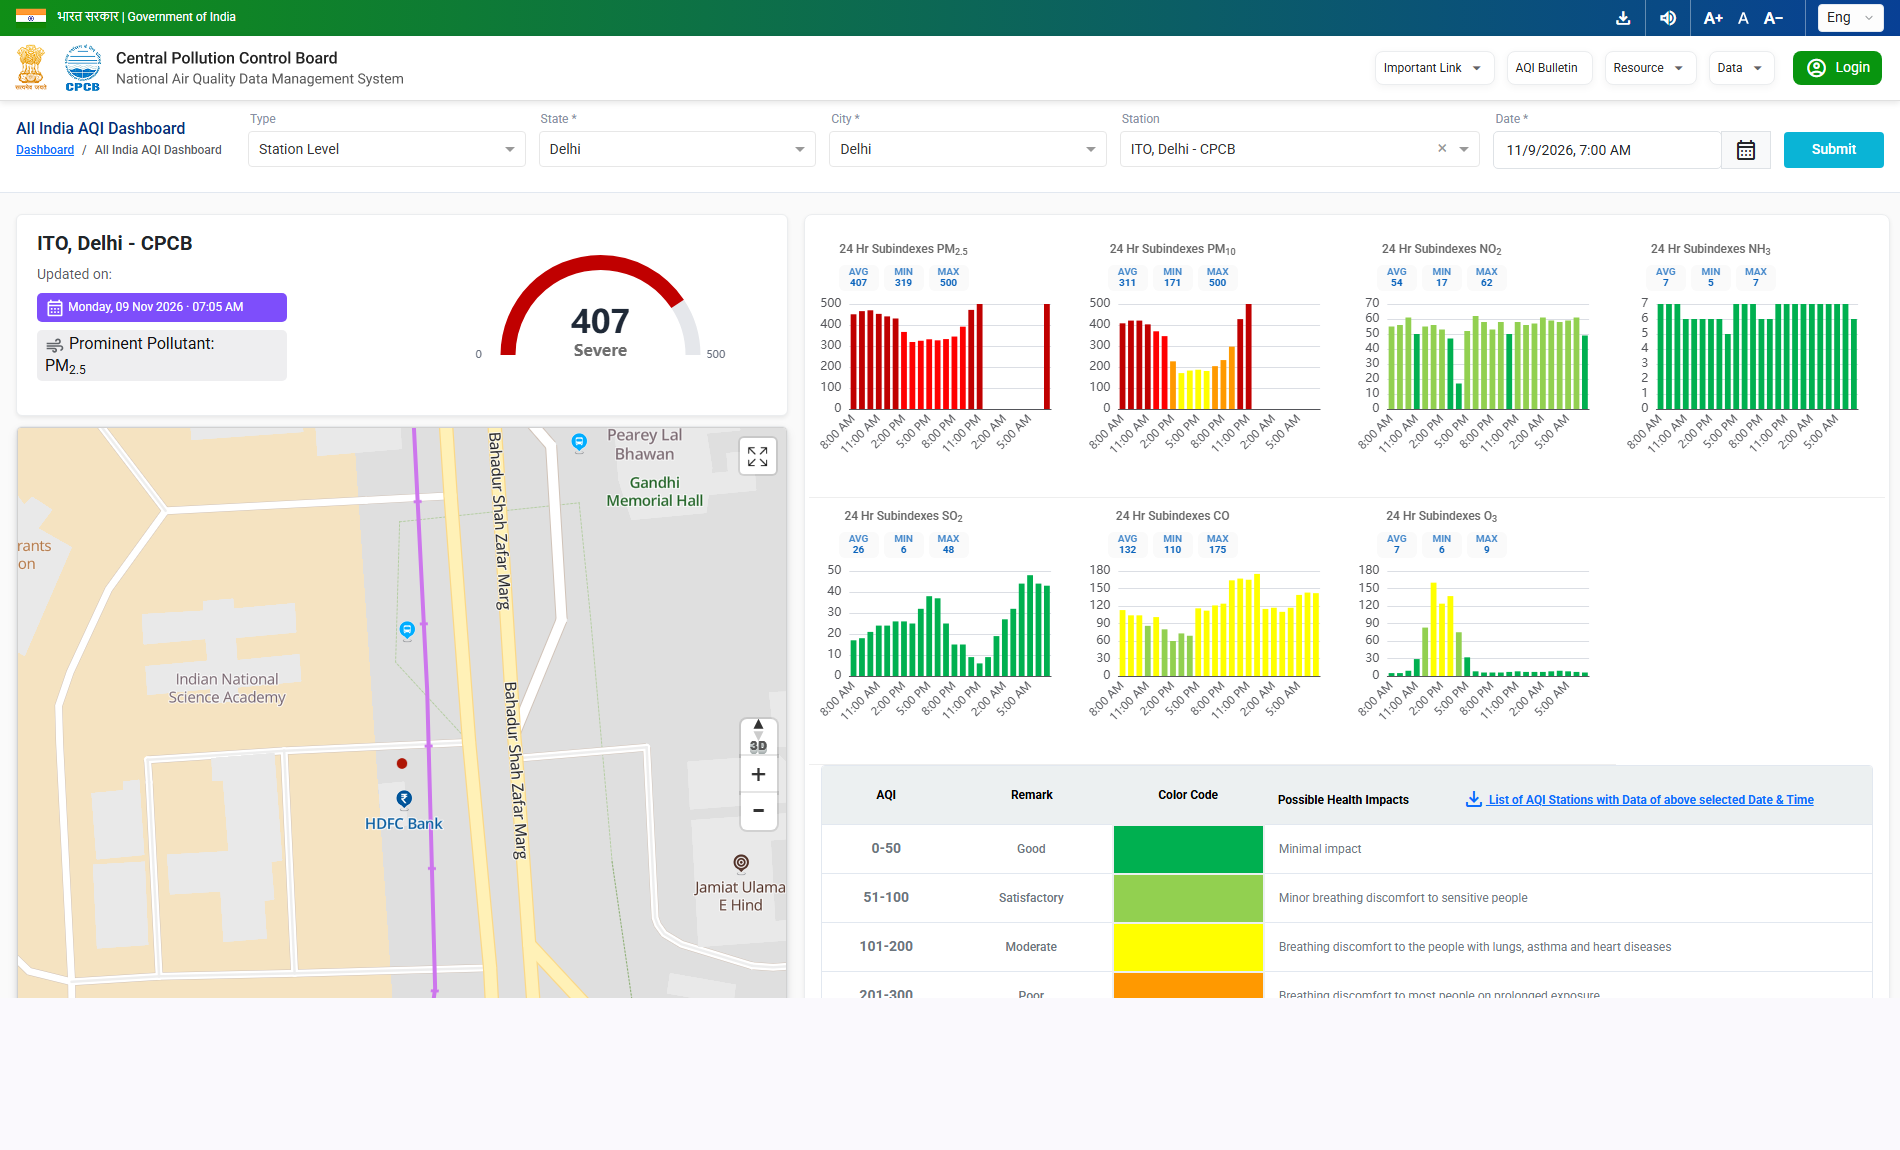
On CPCB’s own All India AQI Dashboard, page updated at 7:05 AM on 9 November 2026, ITO read 407, Severe. On the same page, ITO’s PM2.5 chart had no bar for the seven hours from 11 PM to 6 AM. The page showed ITO’s PM2.5 as AVG 407, MIN 319 and MAX 500.
Source: CPCB All India AQI Dashboard, ITO, page updated 7:05 AM, 9 Nov 2026; captured by this office at 8:05 AM.
At 8 AM on 9 November, and again between 5:19 and 5:27 PM, CPCB’s own public dashboard showed no PM2.5 or PM10 bar for at least one hour between 9 PM and 6 AM at 49 of the 58 Delhi stations whose charts covered the whole night.
This office captured the dashboard page of every one of the 59 Delhi stations twice on 9 November 2026, which it did from 8:01 to 8:08 AM and again from 5:19 to 5:27 PM. Each capture is linked in Annexure B. On the dashboard, a bar stands for the hour that ends at its label, so the bar labelled 2 AM is the hour from 1 to 2 AM. In the morning captures, two stations’ charts were drawn on a shortened time axis, which ran from 8 AM to 12 AM for Tikri Kalan and from 8 AM to 6 AM for NSIT Dwarka. In the evening captures it was NIH Narela’s chart that was drawn on a shortened axis.
Source: CPCB All India AQI Dashboard, all 59 Delhi stations, captured from 8:01 to 8:08 AM and from 5:19 to 5:27 PM on 9 November 2026 (Annexure B)
In both years, the number of stations with a PM2.5 reading held at its daytime level until 10 PM, was lowest between 1 and 3 AM, and began to rise again in the hour from 3 AM.
Last Diwali, at 2 AM on 21 October 2025, 28 of the 40 stations had no PM2.5 reading. Of the 27 of them still in CPCB’s hourly data this year, 23 again had none at 2 AM on 9 November 2026. The hour is 2 to 3 AM in both years.
Diwali night 2025. At 2 AM on 21 October 2025, 28 stations had no PM2.5 reading, although every one of the 28 had readings of other pollutants in that same hour. Each of the 28 had a PM2.5 reading at 9 PM the evening before. The 28 stations are:
In every one of the 115 station-hours between 8 PM and 4 AM with no PM2.5 reading, the record holds the same station’s readings of other pollutants for that hour.

Diwali night 2026. Between 8 PM on 8 November and 4 AM on 9 November there were 162 station-hours with no PM2.5 reading. In 160 of them, CPCB’s hourly data holds the same station’s readings of other pollutants for that hour. At 1 AM, every one of the 36 stations with no PM2.5 reading had gas readings in that same hour. PM10 is not counted as a gas.
The gas readings show that the station’s data link and gas analysers were working in that hour. They do not show why the PM2.5 reading is missing.
At Anand Vihar, CPCB’s hourly data holds no PM2.5 reading from midnight to 3 AM on 9 November 2026, while the same station’s carbon monoxide, nitrogen oxides and ozone readings continue in every one of those hours. Last year it was 11 PM to 4 AM.
Source: CPCB hourly station data for 20 to 21 October 2025 and 8 to 9 November 2026, as compiled by CREA (Annexure A)
Each passage below is quoted in the Court’s own words, with the page on which it appears. The orders open from Annexure B.
On 15 October 2025 the Supreme Court ordered that CPCB “shall monitor the air quality index in their respective jurisdictions starting from 14.10.2025 till 25.10.2025 and file a report before this Court, specifying the air quality of each day”. (Order of 15 October 2025, direction L, pages 20 to 21.)
On 3 November 2025, when the Court sat after Diwali, it asked CAQM and CPCB “to place on record an affidavit indicating the steps proposed to be taken to prevent the air pollution levels from deteriorating further or turning severe within one week from today”. (Record of proceedings of 3 November 2025, page 14.)
On 17 November 2025, an amicus told the Court that Delhi’s monitors “are outdated and they are not suitable for the capital city”. The Court directed the Government of NCT of Delhi “to place on record an affidavit/note specifying therein (i) the nature of equipments being used by the Government, and (ii) the efficiency of the equipments to gauge the air quality”. (Record of proceedings of 17 November 2025, as corrected by the Court, paragraphs 18 and 19, page 22.)
Direction O (page 19). The Court ordered CPCB to monitor the AQI readings and to file a Diwali report “specifying the air quality of each day on 07.11.2026 and 08.11.2026”. Under the same direction, its reports also cover the days before Diwali from 2 to 6 November and the days after it from 9 to 30 November 2026. On Diwali night, at 1 AM on 9 November, 36 of the 59 stations had no PM2.5 reading in CPCB’s hourly data. CPCB’s reports are due by 14 December.
Direction V (page 22). Reports and affidavits are due by 14 December 2026, and the Court said “strict actions of contempt will be taken against the responsible officials, if the aforesaid directions are not complied with”.
Paragraph 16 (page 7). Speaking of the directions it had issued in the matter, the Court recorded: “Despite the clear directions issued by this Court time and again, neither was there effective implementation to the satisfaction of this Court, nor were any of the relevant materials/documents placed to our satisfaction.”
Direction P (page 19). The Court ordered: “The AQI Monitoring Stations, which are alleged to be non-functional, as no data could be retrieved therefrom, ought to be inspected once again. If any defects in their functioning are found, they will have to be rectified with immediate effect. All possible endeavours shall be made for effective monitoring of AQI levels.”
Source: Supreme Court orders and records of proceedings of 15 October 2025, 3 November 2025, 17 November 2025 and 29 October 2026 (Annexure B)
On Diwali night 2025, between 1 and 4 AM, most of Delhi’s stations in CPCB’s hourly data had no PM2.5 reading. On Diwali night 2026 the same thing happened, in the same hours. CPCB and DPCC should publish every missing station-hour, with its reason. Each station’s readings are published on CPCB’s All India AQI Dashboard and in the SAMEER app. On CPCB’s dashboard, an hour with no reading is shown as a gap with no bar. Each reader can open the dashboard page of the station nearest to them, see the last hour that has a bar, and keep a screenshot in which the page’s “Updated on” time is visible.
The hourly data. Every count of stations on this page comes from CPCB’s hourly station data, as compiled by CREA. Only rows whose source is CPCB are used. The 2025 file is CREA_Delhi_Raw_Long_2025.csv (SHA256 4b84a34fb001539199e36b8783d934652f6cd620d801a1d7f96f3b4f32991c60). The 2026 file is CREA_Delhi_Raw_Long_2026_through_2026-11-09.csv, which was received at 9:45 AM on 9 November 2026 (SHA256 d6d695b3a47bf77c2265d73c9fd166bef01f32aae5d85555145037ecd0fc5368). The figure for 2025 that was checked a year later comes from CREA’s live service, which this office queried at 18:15 IST on 8 November 2026. The figures for the days before Diwali in 2018 to 2024 come from the yearly files that make up the same compilation.
What a station is, and when it counts. A station is a distinct CPCB site id in CREA’s compilation, and station names are never used to key a count, because some names changed their spacing on 6 November 2026. A station is counted in an hour when that hour holds a numeric PM2.5 value for it. PM10 is counted the same way.
The list of stations for each night. Each night’s list is the stations that had any PM2.5 reading in the 14 days before noon on that day. The list held 40 stations for Diwali 2025 and 59 for Diwali 2026. Every share on this page names its list.
Hours. All times are Indian Standard Time. In CPCB’s hourly data a time marks the start of the hour that it names, so “1 AM” in a count means the hour from 1 to 2 AM. On CPCB’s dashboard a bar marks the hour that ends at its label, so the bar labelled 2 AM is the hour from 1 to 2 AM. Every dashboard hour on this page is given as a span of two times, so that the reader does not have to convert it.
A minimum reading. Where a count is checked on a floor of 1 microgram per cubic metre instead of any numeric value, a few entries near zero at one station drop out. The lowest count of each Diwali night does not change on that floor, in either year.
Where the 2026 night is settled. The 9:45 AM file and CREA’s later copy of the same data agree in every hour from 6 PM to 8 AM, which means that the count is settled up to the hour from 7 to 8 AM on 9 November. The hour from 8 to 9 AM was still being filled in, and no figure uses it.
The 13 new stations: the share and the averages. Take an average over only the 39 older stations and the 13 that had a reading in a given hour. In the hours from 1 to 4 AM the 13 lowered that average by 2.5 to 7.6 per cent, against 3.1 to 9.4 per cent in the hours from 6 to 10 PM. On the median the 13 lowered it by 10.0 to 18.6 per cent from 1 to 4 AM, against 3.1 to 11.0 per cent from 6 to 10 PM, but a median of 21 to 27 stations moves when one station drops out. None of these figures is Delhi’s air in those hours, because each is taken over the stations that still had a reading.
The 13 new stations: the evening levels by group. From 6 PM to 10 PM on 8 November 2026, the median PM2.5 reading was 151.3 micrograms per cubic metre for the 13, 193.0 micrograms per cubic metre for the 39 and 149.1 micrograms per cubic metre for the 7, over 52, 153 and 28 station-hours. The 13’s median was 21.5 per cent below the 39’s. The 7 read about as low as the 13. Measured against their own nearest older stations, however, the 7 read 0.7 per cent above them, while the 13 read 35.5 per cent below theirs.
The 13 new stations: the file. The figures for the 13, the 39 and the 7 rest on CREA’s compilation saved at 5:05 PM on 9 November 2026, SHA256 5e8674ebf59e0b8e8076cfc7a7cc672f6fc31879b61610961797d4bc24b81e7e. Its count of stations agrees with the 9:45 AM file in every hour of the night, and the 43 readings this office recorded from the 9:45 AM file agree with it to within 0.05 micrograms per cubic metre. The rows used are linked in Annexure B.
Source: CPCB hourly station data for 8 to 9 November 2026, as compiled by CREA, file saved at 5:05 PM on 9 November 2026, whose SHA256 is given above; stations grouped by site id as in the investigation of 7 November 2026; PM2.5 in micrograms per cubic metre; this office’s counts and averages.
The three days before Diwali. A station-day counts when it has at least 16 valid hourly PM2.5 readings out of 24, where valid means above 0 and below 1,000 micrograms per cubic metre. A monitor enters the three-day mean when at least half of the three days are valid for it. The figure is the mean of the monitors’ means. The 23 monitors are those with a PM2.5 and a PM10 mean for the seven days before Diwali in every year from 2018 to 2026.
The 36 nights of 2026. Each night from 4 October to 8 November 2026 is measured by its lowest share of stations that had a PM2.5 reading in any hour between 8 PM and 7 AM, and that share is taken on the night’s own 14-day list. The list grew from 45 to 59 stations as those weeks went by.
The eight Diwali dates. Some households kept Diwali on 1 November 2024, when the fewest was 33 of 39, and the 2025 record holds whichever of the two dates is used.
The eight dates, which the table in section 2 also lists, are these:
The dashboard captures. CPCB’s All India AQI Dashboard asks a person to answer an image check each time that a page loads, and a person answered it every time. The morning captures were made from 8:01 to 8:08 AM on 9 November 2026, when the page showed that it had been updated at 7:05 AM. The evening captures were made from 5:19 to 5:27 PM, when the page’s date box read 5:00 PM, which meant that its 24-hour window still held the night from 6 PM. The gaps were read from each station’s PM2.5 and PM10 charts, and the number of hour slots was fitted to the bars that each chart itself draws.
Each file name below is a link to the file on hawakahisab.in, and the four charts are drawn inside this page itself, so no separate file is listed for them.
| Document | File on this site | SHA256 | Note |
|---|---|---|---|
| CPCB dashboard, ITO, page updated 7:05 AM on 9 November 2026, captured at 8:05 AM | Delhi_Diwali_2026_ITO_CPCB_Dashboard_0705AM.png | aa847bf6842ff62e506e6e556d5a3d19f4200101bfef7b8082e4b695cc3baa79 | Carries the ITO figures in section 3 |
| CPCB dashboard, all 59 Delhi stations, captured 8:01 to 8:08 AM on 9 November 2026 | Delhi_Diwali_2026_CPCB_Dashboard_9Nov_0801-0808AM.zip | e31263bef20d43c0b9dfe9c96363ec6255a51112c7101f11a8c579755e593f9c | One image per station; MANIFEST.csv gives each image’s SHA256, and its own SHA256 is 2e51f2bb5055c753af4fc7c0806260123810f5509f3cadd943edf4541803e59e; GAPS_v2.csv gives the hour by hour reading of each chart’s missing bars; Tikri Kalan and NSIT Dwarka are drawn on a shortened time axis |
| CPCB dashboard, all 59 Delhi stations, captured 5:19 to 5:27 PM on 9 November 2026 | Delhi_Diwali_2026_CPCB_Dashboard_9Nov_0519-0527PM.zip | 515bb378b614eda31b928ba332b61073d9b682c0dba1244006deb932f5bfbc06 | One image per station; MANIFEST.csv gives each image’s SHA256, and its own SHA256 is 06941fe5f23c38ff187aaabf6089c853e99c9f324c202770e21d8fd7ba7198da; GAPS_v2.csv gives the hour by hour reading of each chart’s missing bars; NIH Narela is drawn on a shortened time axis |
| Supreme Court, Arjun Gopal v. Union of India, W.P.(C) 728/2015, order of 29 October 2026 | Supreme_Court_WPC728-2015_Order_29-Oct-2026.pdf | 853f90a24f2011e501ae2b8e4f86aab32be31e597e5e690579e2d245d8f09f21 | Direction A on page 14; directions O and P on page 19; paragraph 16 on page 7; direction V on page 22 |
| Supreme Court, M.C. Mehta v. Union of India, W.P.(C) 13029/1985, order of 15 October 2025 | Supreme_Court_WPC13029-1985_Order_15-Oct-2025.pdf | 263e5ec272c271870018b54ce395688ebe60afd973dc317b850de70eac502871 | Direction E and direction L, pages 19 to 21 |
| Supreme Court, W.P.(C) 13029/1985, record of proceedings of 3 November 2025 | Supreme_Court_WPC13029-1985_Record_03-Nov-2025.pdf | 38d14dfbafe28fe8b88d5c1f4003225c18f75bb97594113d9cbc7b7ab7f296de | Page 14 |
| Supreme Court, W.P.(C) 13029/1985, record of proceedings of 17 November 2025, as corrected by the Court | Supreme_Court_WPC13029-1985_Record_17-Nov-2025_corrected.pdf | 3c9bbae7741a88ed25f992310ab76a839602b6dfdeffb95c00f0e4c218a5685e | Paragraphs 18 and 19, page 22 |
| CPCB hourly PM2.5 and PM10 rows for Delhi, 8 to 9 November 2026, from CREA’s compilation saved at 5:05 PM on 9 November 2026 | Delhi_Diwali_2026_CPCB_Hourly_PM25_PM10_8-9Nov.csv | 8cd5f7d10d9cec3d2b0fe2844a2120d04fee77e8427b9d5a6fc903d20524e246 | The rows behind the counts for the 13, the 39 and the 7 in section 3; stations are keyed by site id |