Special investigation
13 new monitors lowered Delhi’s AQI on all 26 days, by 11.6 points on average
Published by Shri Ajay Maken | 7 November 2026 | hawakahisab.in
In this report: the main figure · who was added, and when · how the new stations read · what HT reported · what the data cannot show · sources
The main figure
Thirteen monitors added in October lowered Delhi’s 4 PM AQI by 11.6 points on average from 13 October to 7 November 2026. On 7 November, CPCB’s 369 would have read 380 to 382 without them, which is still in the Very Poor band.
Over the same 26 days the 13 new stations read 57.1 points below the 39 older stations on average, and they read below them on 26 of the 26 days. This report removed 20,000 random sets of 13 older stations from the city average, but none came near the effect of the 13. The highest rise from a random set was 4.9 points in this run of 20,000 draws, while the 13 gave 11.6.
The lowering ranged from 0.6 to 18.1 points a day, and it was 10 points or more on 20 of the 26 days. When any one of the 13 is left out, the other twelve still lower the figure by 9.9 to 11.6 points on average, so no single station drives it.
Every figure here is a reconstruction of CPCB’s 4 PM city figure. It is built from CPCB’s own station readings, and it is capped at 500, as CPCB caps it. Over 67 days, from 1 September to 7 November 2026, it tracked CPCB’s daily bulletin within 1.01 points on average. CPCB explains its own formula in How AQI is calculated and in its AQI calculator.
Who was added, and when
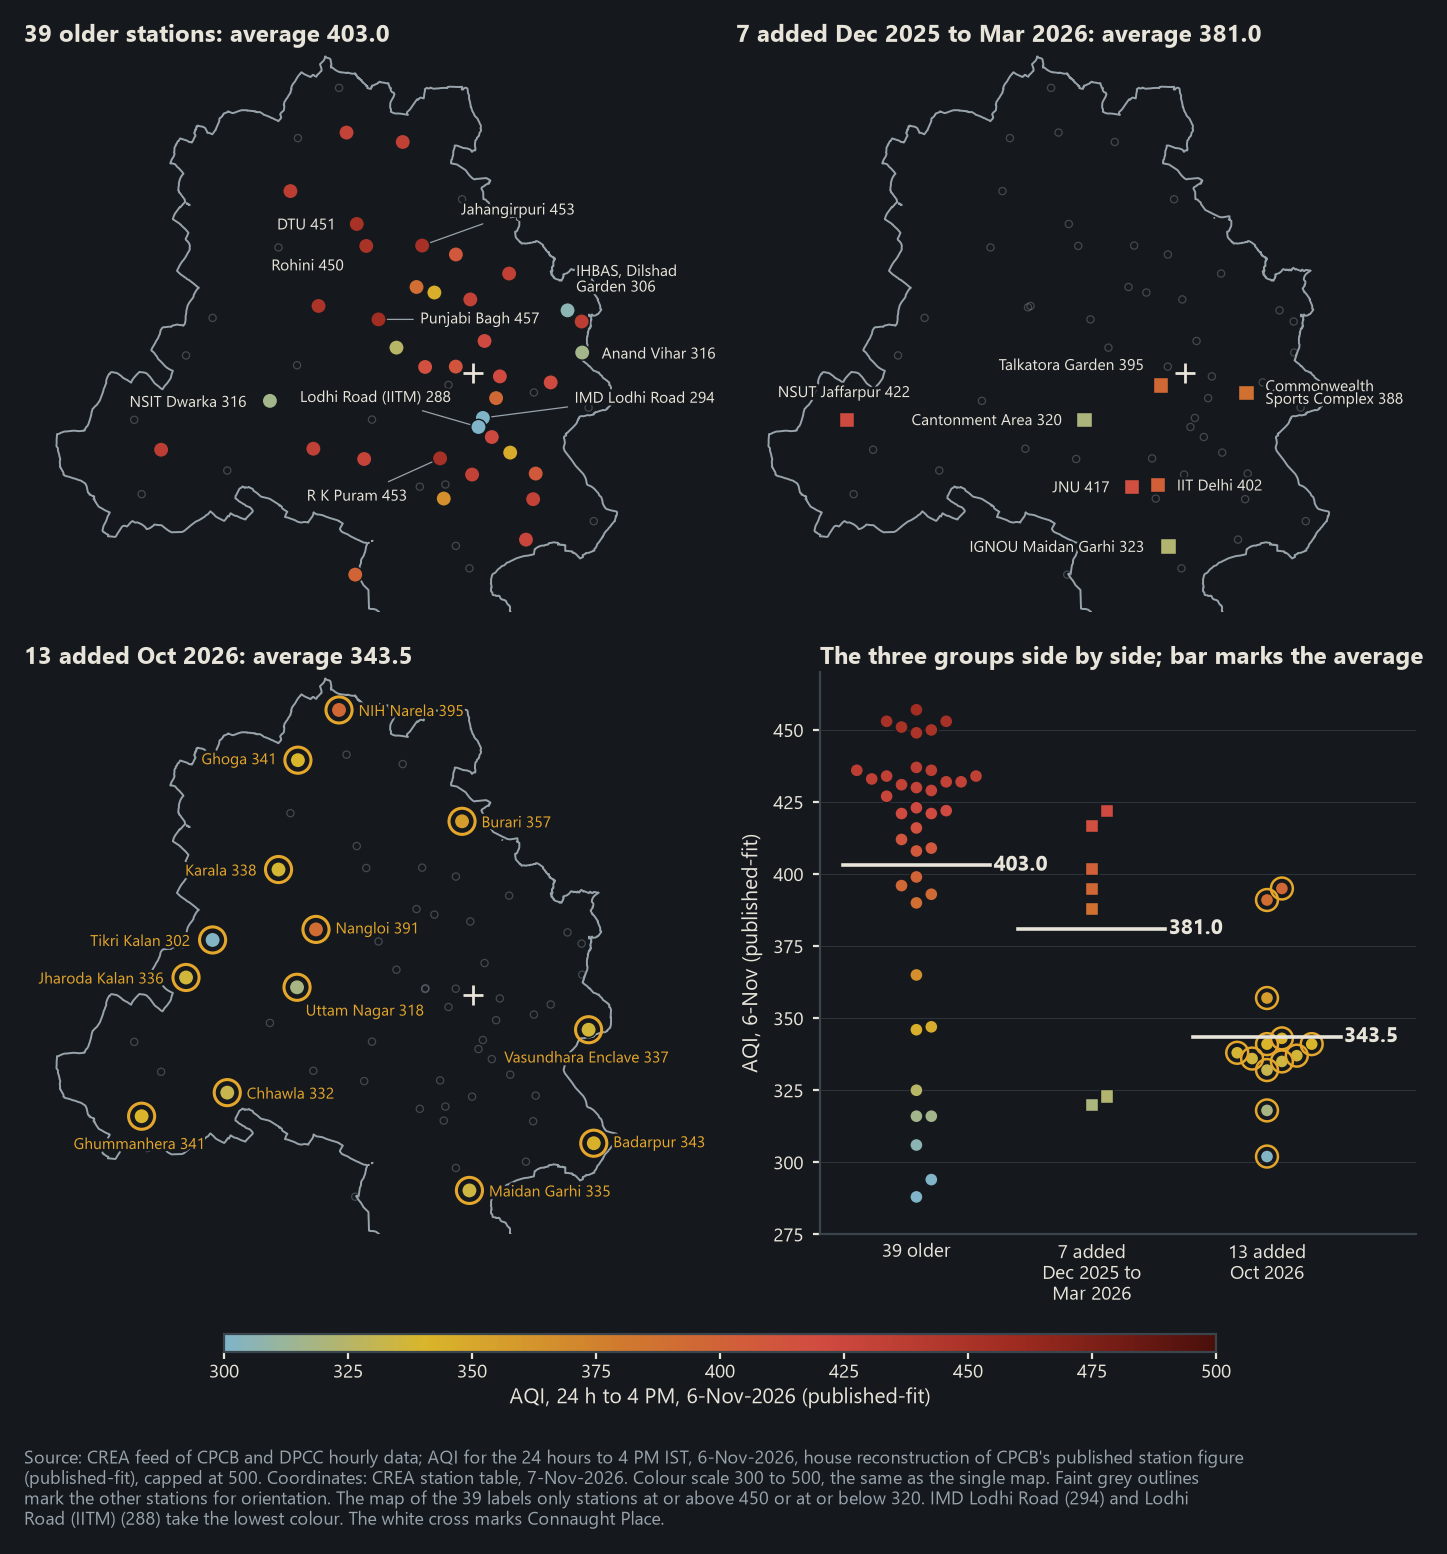
Delhi’s network grew from 39 stations to 59 in two waves. The 13 are all Delhi Pollution Control Committee (DPCC) stations, and they first reported between 6 and 12 October 2026. A first wave of 7 joined between December 2025 and March 2026. It holds six DPCC stations and IIT Delhi, which IITM runs.
How the new stations read
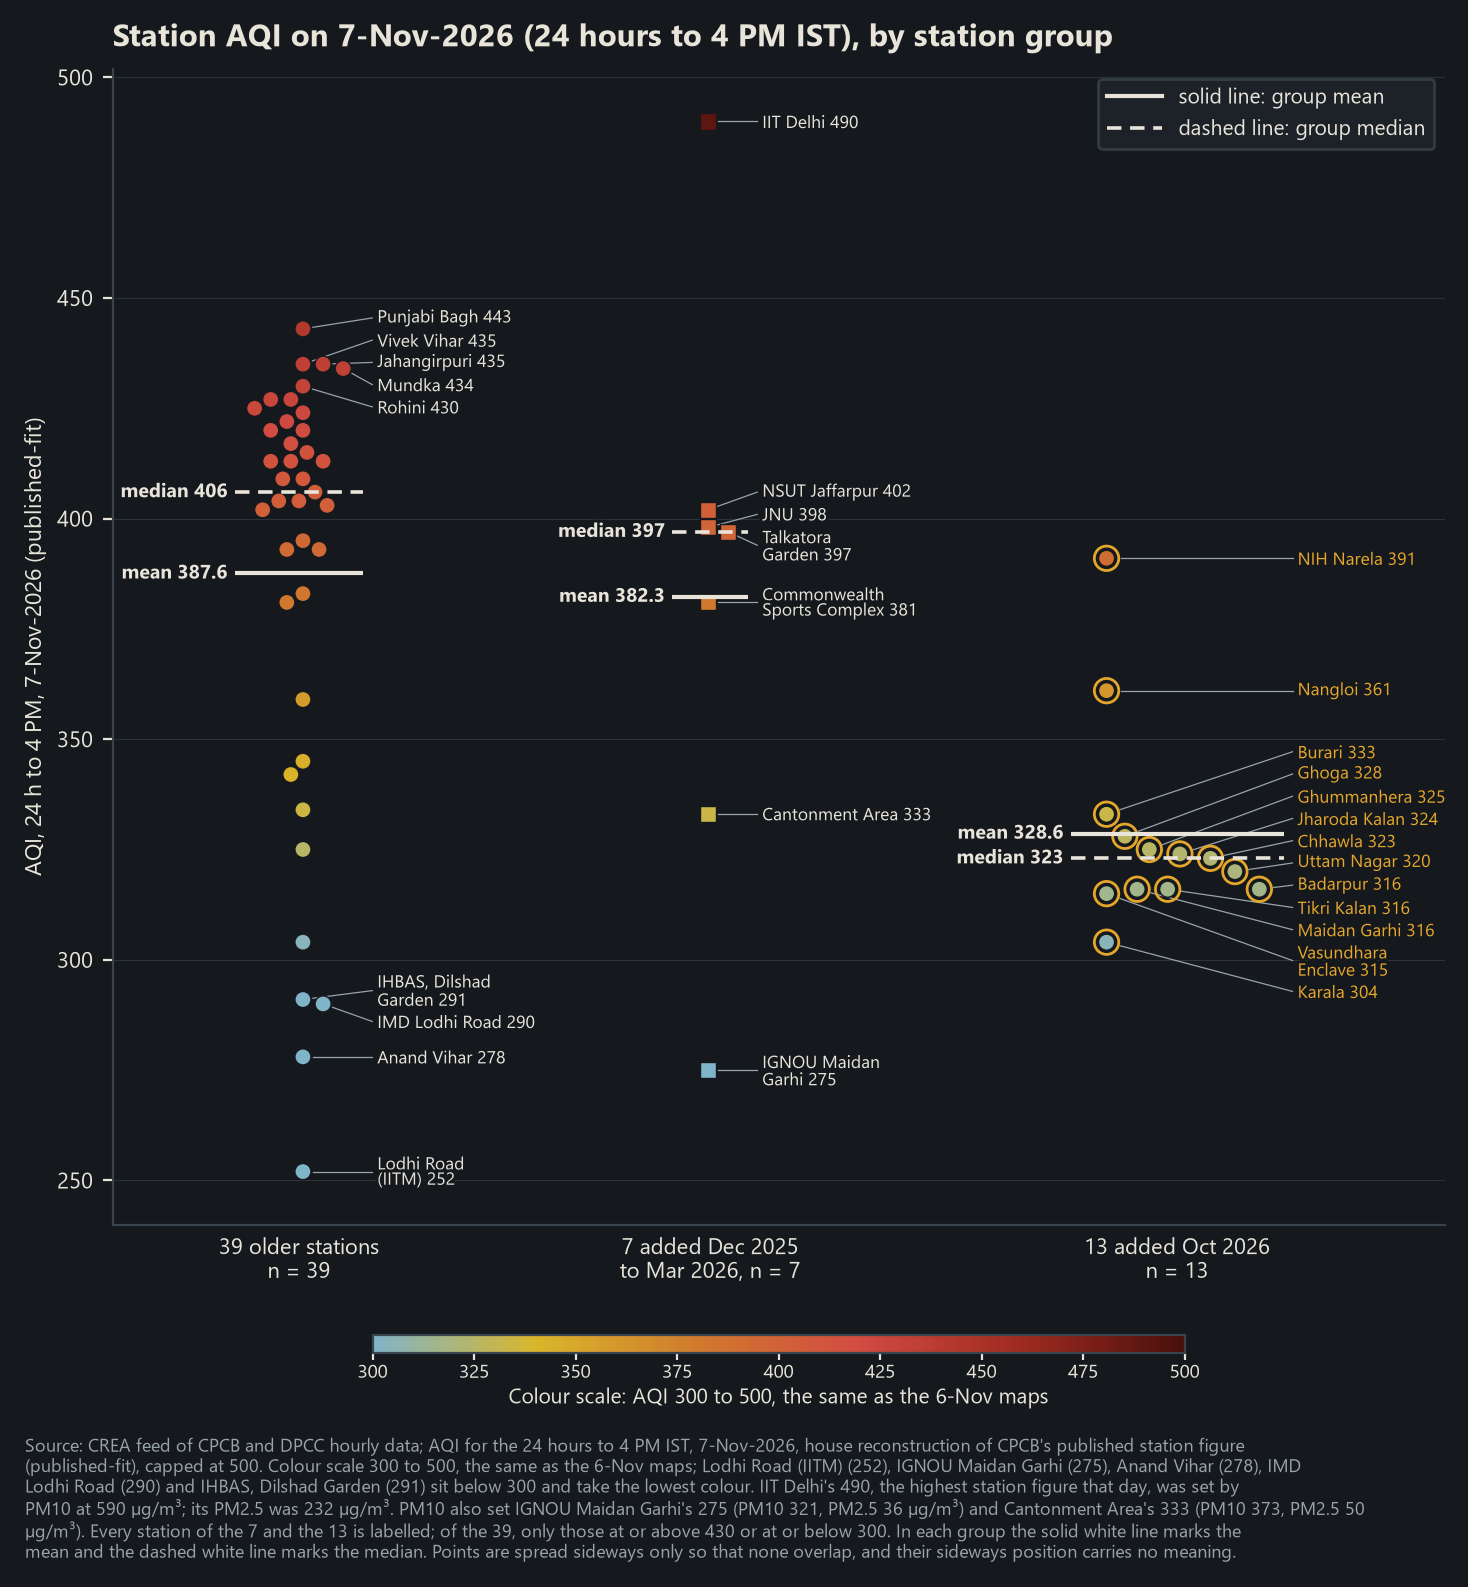
On 7 November the 39 older stations averaged 387.6, while the 13 averaged 328.6. IIT Delhi, which is one of the 7, read 490. That was the highest station figure in Delhi that day. Its PM10 reading of 590 µg/m³ set that figure, while its PM2.5 read 232 µg/m³.
The 13 read about 35 per cent less PM2.5 than the older Delhi stations nearest them, on the median of 325 station-days. If the NCR monitors across the boundary are counted as neighbours, the gap is 29.5 per cent. The 13 move hour by hour with the older stations nearest them, but they do so at about two-thirds of the level.
The evidence on the 7 is only a lead. Over the same 26 days they lowered the city figure by 1.4 points, and 375 of 20,000 random sets of seven older stations did as much. Most of their effect sits at IGNOU Maidan Garhi and Cantonment Area. At both, PM2.5 reads about a fifth of the older stations nearby, while PM10 reads about three-quarters. So the two particle readings disagree with each other.
What HT reported
The Hindustan Times reported on its front page of 7 November 2026 that “Without the new stations, Friday’s 4pm bulletin would have read 393.” This report reproduces 392.9 to 394.4. HT also reported that PM2.5 at the new stations is “about 35% lower than those at their neighbouring stations”. This report finds 35.06 per cent. Both figures come from the same CPCB feed, so the agreement confirms the arithmetic. “Understating” is HT’s word, but the data cannot say whether the new readings or the older ones are right.
What the data cannot show
The data cannot say which readings are right, and they cannot say why any site was chosen. DPCC should make available the calibration and maintenance records of the 13 new stations. It should do the same for the PM2.5 analysers at IGNOU Maidan Garhi and Cantonment Area. IITM should make available those of the PM10 analyser at IIT Delhi. If a reference monitor stood beside two or three of the 13 for two weeks, it would settle which readings are right.
Sources
The station readings are CPCB and DPCC hourly data to 4 PM IST on 7 November 2026, which come from CREA’s public feed of CPCB data. The city figures are CPCB’s daily AQI bulletins from 1 September to 7 November 2026. They include 382 on 6 November, when 57 of 59 stations were counted, and 369 on 7 November, when all 59 were counted. The HT story is “New stations on periphery cloud AQI data in Capital”, on the front page of 7 November 2026. All calculations were made on 7 November 2026, and the full report carries every figure, its method and its cautions.